Monitoring Puma web server performance
Puma is probably the most popular choice for running Ruby applications these days, with primary focus on speed and concurrency. Reminiscent of Unicorn, but unlike it's single-treaded model, Puma brings multi-threading game to the field, scales up with multiple processes per host (like Unicorn) and uses available resources more efficiently. All that gives us a better bang for our buck!
Gitlab has somewhat recently completed migration to Puma and provided background information, challenges and interesting charts in the blog post, if you're interested. Obviously not everyone operates at Gitlab scale, but having a reference point is quite handy.
Multi-threaded environment
Puma is built around concepts of Threads and Workers. Each thread can only process a single request, managed by a thread pool. This pool can scale number of available threads up and down, depending on how busy the server is. Upon boot, Puma will create a minimal amount of threads, and allocate more when other worker threads are busy servicing client requests. Idle threads then get terminated over time. Workers are individual processes, managed by the master Puma process, and allow better CPU utilization on systems with multiple cores.
One important aspect of operating Puma efficiently is picking the right thread pool capacity. Say, we want to run 4 worker processes, 10 threads each. That makes our total capacity at 40 threads, with Puma running in clustered mode. Thread pool size highly depends on the application (especially for heavy rails apps), so running a few basic tests prior to deploying Puma to production is a must.
Memory, CPU and database connection pool constraints are the first thing to figure out: over-utilization could lead to slow response times, timeouts and frequent server restarts. Memory leaks and thread-safety bugs in the application/gems could also contribute to instability. Using a tool like rack-mini-profiler could help identify low hanging performance improvements. Plenty of commercial products are available in this space: NewRelic, Scout, DataDog, Skylight, and others.
Master process stats
Understanding how Puma server performs in production environment is equally important as capacity planning. There are a several solutions that could help us understand what's happening under the hood. Puma master process provides an easy way to fetch operational metrics (stats in clustered mode are similar):
# Execute the code anywhere in controller/request handler
pp Puma.stats_hash
# Puma.stats returns the same data in JSON format

{:started_at=>"2023-01-10T19:31:58Z",
 :backlog=>0,
 :running=>1,
 :pool_capacity=>4,
 :max_threads=>5,
 :requests_count=>123,
 :versions=>{:puma=>"6.0.1", :ruby=>{:engine=>"ruby", :version=>"3.1.3", :patchlevel=>185}}}
Stats are designed to give you just a baseline, with max_threads representing the
maximum number of worker threads on a single host, pool_capacity a number of
threads available in reserve. Pool capacity dropping to 0 indicates 100% utilization (all threads are busy).
Any additional requests will be be queued up and serviced by the next available thread.
Such queueing will cause spikes in overall request latency. More on backlog metric later,
while we cover the stats fetching part first.
Pumactl
Puma comes with a pumactl CLI, with stats command among other goodies. We'll
have to activate Puma control app first:
# config/puma.rb
state_path "tmp/puma.state"
activate_control_app "unix://tmp/pumactl.sock"
Then query the stats. We should get back the same hash we saw earlier:
$ bundle exec pumactl stats
{
  "started_at": "2023-01-10T19:32:10Z",
  "backlog": 0,
  "running": 1,
  "pool_capacity": 5,
  "max_threads": 5,
  "requests_count": 0,
  "versions": {}
}
Rack middleware
Another option is to add stats endpoint with a Rack middleware. Keep in mind though,
Puma.stats call will return empty results when running Puma in clustered mode, since
the stats are only available in the master process.
# add middleware to your config.ru file
class PumaStats
  def initialize(app)
    @app = app
  end

  def call(env)
    if env["REQUEST_PATH"] == "/_puma"
      return [200, {"Content-Type" => "application/json"}, [Puma&.stats]]
    end

    @app.call(env)
  end
end

use PumaStats
run Rails.application
# or run Sinatra::Application if using sinatra
We're exposing our endpoint http://yoursite.com/_puma to the internet, so make
sure to throw some form of auth on it (basic auth will do). Also, the downside is
the endpoint will be unavailable when server is overloaded, so it should not be
used for reliability reasons.
Prometheus metrics
The most common format these days. Integrating prometheus metrics endpoint into Puma should be straightforward with puma-metrics gem:
# config/puma.rb
plugin "metrics"
Query the http://localhost:9393/metrics endpoint and get back something like:
# TYPE puma_backlog gauge
# HELP puma_backlog Number of established but unaccepted connections in the backlog
puma_backlog{index="0"} 0.0
# TYPE puma_running gauge
# HELP puma_running Number of running worker threads
puma_running{index="0"} 1.0
# TYPE puma_pool_capacity gauge
# HELP puma_pool_capacity Number of allocatable worker threads
puma_pool_capacity{index="0"} 5.0
# TYPE puma_max_threads gauge
# HELP puma_max_threads Maximum number of worker threads
puma_max_threads{index="0"} 5.0
# TYPE puma_requests_count gauge
# HELP puma_requests_count Number of processed requests
puma_requests_count{index="0"} 0.0
# TYPE puma_workers gauge
# HELP puma_workers Number of configured workers
puma_workers 1.0
Prometheus exporter
Generally, prometheus metrics are being pulled by an agent from a /metrics endpoint
defined in the app (or running on a separate port). Alternatively, we could use a
push model, with metrics pushed by various application processes (puma, sidekiq, etc)
into metrics gateway. That's exactly what prometheus-exporter project is designed for.
First, we start the shared metrics collector server running on localhost:9394:
bundle exec prometheus_exporter
Configure Puma to send stats:
# config/puma.rb
after_worker_boot do
  require "prometheus_exporter"
  require "prometheus_exporter/instrumentation"

  if !PrometheusExporter::Instrumentation::Puma.started?
    PrometheusExporter::Instrumentation::Puma.start
  end
end
Once Puma master process starts, the metrics should be available at http://localhost:9394/metrics:
# metrics are similar to whats available in puma-metrics
ruby_puma_workers{phase="0"} 1
ruby_puma_booted_workers{phase="0"} 1
ruby_puma_old_workers{phase="0"} 0
ruby_puma_running_threads{phase="0"} 1
ruby_puma_request_backlog{phase="0"} 0
ruby_puma_thread_pool_capacity{phase="0"} 5
ruby_puma_max_threads{phase="0"} 5
Request queueing
If you're familiar with Unicorn server Raindrops plugin, one of the features
it provides is TCP listener stats, such as active and queued requests counters (linux only).
A clear indication that application is slowing down or becoming unresponsive is
when queued number goes above zero and constantly growing. In the end, requests
are dropped after reaching the socket backlog threshold (default is 1024).
Coming back to Puma stats, there's a backlog counter, and its a bit misleading.
Backlog represents the number of requests that have made it to a worker but yet to
be processed. The value will normally be zero, as requests queue on the TCP/Unix socket
in front of the master Puma process, but not in the worker thread pool. More on this
in Puma's PR. So, backlog metric on
itself does not provide us with enough insight.
Observing backlog and congestion could be done by measuring the time HTTP requests
are spending in a queue. To do that, a load balancer or a proxy that's sitting in
from of application server must inject a special request header X-Request-Start.
Header includes the time when the request was originally accepted (example: X-Request-Start: t=1672959683270345),
so when application gets to process the request, it could measure the delay.
NOTE: AWS Load balancer injects the request start time as part of the X-Amzn-Trace-Id header.
Time is hex-formatted unix epoch in seconds, and lacks precision.
Queue time tracking
With Puma server only processing fully buffered requests, it cannot determine the
actual request start time, hence the need to use a value already embedded in the
headers by another proxy. To determine time spent in queue, all we have to do is
compare the current wall time with what's provided in X-Request-Start header
(this requires good time sync).
If running on Nginx, you can simply add this header yourself:
location / {
  proxy_set_header X-Request-Start "t=${msec}";
  proxy_pass http://app;
}
An example Rack middleware:
# config.ru
class MeasureQueueTime
  def initialize(app)
    @app = app
  end

  def call(env)
    value = env['HTTP_X_REQUEST_START'].to_s
    if value != ''
      value.gsub!(/t=|\./, '')
      start_time = "#{value[0, 10]}.#{value[10, 13]}".to_f # to make timestamp uniform

      env["rack.request.queue_time"] = Time.now.to_f - start_time.to_f
    end

    @app.call(env)
  end
end

use MeasureQueueTime
run Rails.application
To see if its working we'd add a log statement in our Rails consoller:
class ApplicationController < ActionController::Base
  before_action do
    if queue_time = request.env["rack.request.queue_time"]
      Rails.logger.info "WAITED: #{queue_time}"

      # EXTRA NOTE:
      # Puma also provides an additional timing request.env["puma.request_body_wait"]
      # that you can make use of. It represents the time spent waiting for the
      # HTTP request body to be received to the Rack app.
    end
  end
end
Now, we can send a test request with timing:
curl -H "X-Request-Start: t=$(date +%s)" http://localhost:5000/
In rails log we see:
WAITED: 0.7021398544311523
Bonus point if your're using Rails with lograge gem. We could include request queue timing info alongside other request parameters in the log:
# config/application.rb

module Myapp
  class Application < Rails::Application
    # ...
    config.lograge.enabled = true
    config.lograge.formatter = Lograge::Formatters::Json.new
    config.lograge.custom_payload do |controller|
      {
        queued: controller.request.env["rack.request.queue_time"]
      }
    end
  end
end
With lograge you'll see new timings in the request log:
{
  "method": "GET",
  "path": "/",
  "format": "*/*",
  "controller": "ApplicationController",
  "action": "index",
  "status": 200,
  "duration": 0.67,
  "view": 0.28,
  "db": 0,
  "queued": 0.97
}
Depending on your logging ingestion situation, you can parse these values and convert them into metrics later, setup alerts, etc.
Observability
Baseline stats that Puma provides alone does not paint the whole picture, as important data like CPU/memory utilization, request processing times, error counts, etc. are all missing and fairly substantial for determining overall health of the system. Luckily, there's no shortage of products offering performance insights, like NewRelic and Datadog.
Prometheus-exporter project mentioned earlier in the post is a great starting point for adding basic instrumentation into your Ruby/Rails apps, and easy to self-host too. Support for gems like Sidekiq, Puma, Unicorn, ActiveRecord is already baked in, which is nice.
Instrumentation
To get started, add the config/initializers/metrics.rb file:
require "prometheus_exporter"
require "prometheus_exporter/client"
require "prometheus_exporter/middleware"
require "prometheus_exporter/instrumentation"

# Optionally label all metrics with a machine hostname.
#
# Since we're exporting data from multiple worker instances, having an extra distinct
# label to identify where it's coming from might be necessary, unless your Prometheus
# scraper already applies that during ingestion.
#
PrometheusExporter::Client.default = PrometheusExporter::Client.new(
  custom_labels: { hostname: PrometheusExporter.hostname }
)

Rails.application.middleware.unshift PrometheusExporter::Middleware
Next, configure Puma to use instrumentation in single or cluster modes:
# config/puma.rb

if num_workers = ENV["PUMA_WORKERS"]
  workers num_workers
end

def start_puma_instrumentation
  require "prometheus_exporter"
  require "prometheus_exporter/instrumentation"

  if !PrometheusExporter::Instrumentation::Puma.started?
    PrometheusExporter::Instrumentation::Process.start(type: "puma_master")
    PrometheusExporter::Instrumentation::Puma.start
  end
end

after_worker_boot do
  start_puma_instrumentation
end

on_worker_boot do
  ActiveSupport.on_load(:active_record) do
    ActiveRecord::Base.establish_connection
    PrometheusExporter::Instrumentation::ActiveRecord.start
  end

  PrometheusExporter::Instrumentation::Process.start(type: "puma_worker")
end

# Allow running instrumentation in single process mode
if !ENV["PUMA_WORKERS"]
  start_puma_instrumentation
end
To run both rails server and prometheus_exporter, we could use Procfile:
web: bundle exec puma
prometheus: bundle exec prometheus_exporter
Once started and let run for a bit, we'll collect metrics via http://localhost:9394 such as:
# Controller code timing
ruby_http_requests_total{action="index",controller="application",status="200"} 37
ruby_http_request_duration_seconds{action="index",controller="application",quantile="0.99"} 0.026710000121966004
ruby_http_request_duration_seconds_sum{action="index",controller="application"} 0.693330000154674

# Redis client timings
ruby_http_request_redis_duration_seconds{action="index",controller="application",quantile="0.99"} 0.0051460000686347485
ruby_http_request_redis_duration_seconds_sum{action="index",controller="application"} 0.03095099958591163
ruby_http_request_redis_duration_seconds_count{action="index",controller="application"} 37

# Database queries timings
ruby_http_request_sql_duration_seconds{action="create",controller="items",quantile="0.99"} 0.0031549998093396425
ruby_http_request_sql_duration_seconds_sum{action="create",controller="items"} 9.837290009716526
ruby_http_request_sql_duration_seconds_count{action="create",controller="items"} 10000

# HTTP request timings
ruby_http_request_queue_duration_seconds{action="index",controller="application",quantile="0.99"} 0.8986108303070068
ruby_http_request_queue_duration_seconds_sum{action="index",controller="application"} 1.0557448863983154
ruby_http_request_queue_duration_seconds_count{action="index",controller="application"} 2

# Memory profile
ruby_heap_free_slots{type="puma_master",pid="55828"} 385
ruby_heap_live_slots{type="puma_master",pid="55828"} 259492
ruby_rss{type="puma_master",pid="55828"} 0
ruby_rss{type="puma_worker",pid="55829"} 0
ruby_major_gc_ops_total{type="puma_master",pid="55828"} 6
ruby_major_gc_ops_total{type="puma_worker",pid="55829"} 10
ruby_minor_gc_ops_total{type="puma_master",pid="55828"} 33
ruby_minor_gc_ops_total{type="puma_worker",pid="55829"} 254
ruby_allocated_objects_total{type="puma_master",pid="55828"} 680587
ruby_allocated_objects_total{type="puma_worker",pid="55829"} 32309818

# Active record pool stats
ruby_active_record_connection_pool_connections{pool_name="primary",pid="55829"} 0
ruby_active_record_connection_pool_busy{pool_name="primary",pid="55829"} 0
ruby_active_record_connection_pool_dead{pool_name="primary",pid="55829"} 0
ruby_active_record_connection_pool_idle{pool_name="primary",pid="55829"} 0
ruby_active_record_connection_pool_waiting{pool_name="primary",pid="55829"} 0
ruby_active_record_connection_pool_size{pool_name="primary",pid="55829"} 5

# Puma stats
ruby_puma_workers{phase="0"} 1
ruby_puma_booted_workers{phase="0"} 1
ruby_puma_old_workers{phase="0"} 0
ruby_puma_running_threads{phase="0"} 1
ruby_puma_request_backlog{phase="0"} 0
ruby_puma_thread_pool_capacity{phase="0"} 5
ruby_puma_max_threads{phase="0"} 5
Ton to unpack in here. First, documentation on each metric collector is available
in the README, and is pretty detailed. Most of these metrics come from the
Rails integration and provide a good deal of visibility into performance, sets are
generated per process and labeled with pid (process id).
Quick explainer on what some of these metrics represent:
| Group | Description |
|---|---|
http_requests_* |
Counts requests processed by the app, with per controller/action granularity. Also provides timing bucket (quantiles). |
http_request_redis_* |
Tracks time spent interacting with Redis server if it's being used in the app by default. |
http_request_sql_* |
Tracks time spent in ActiveRecord layer. Useful for identifying slow controllers/actions. |
active_record_connection_* |
Tracks database connections pool, per rails process. Pretty useful for detecting congestions, where AR pool is exhausted causing timeouts. |
puma_* |
Puma master process stats, we've seen this one before. |
heap*, allocated_*, rss* |
Various metrics for memory usage and object space. |
Charting
Prometheus-exporter only provides us with the aggregation gateway, so we still need to
have a way of charting the ingested metrics. For testing purposes you can setup a local
Prometheus server
and pull metrics from localhost:9394. Grafana will cover the
charting capability and use Prometheus server as a source. Running this whole stack
locally is very straightforward, with loads of tutorials available online.
Now that we have some data to look at, we could build a simple health dashboard for the app using predefined Puma/Rails metrics. I've used a dummy app with artificial load for testing: is pretty much maxed out and approaching the breaking point, as there's no spare capacity with already substantial backlog.
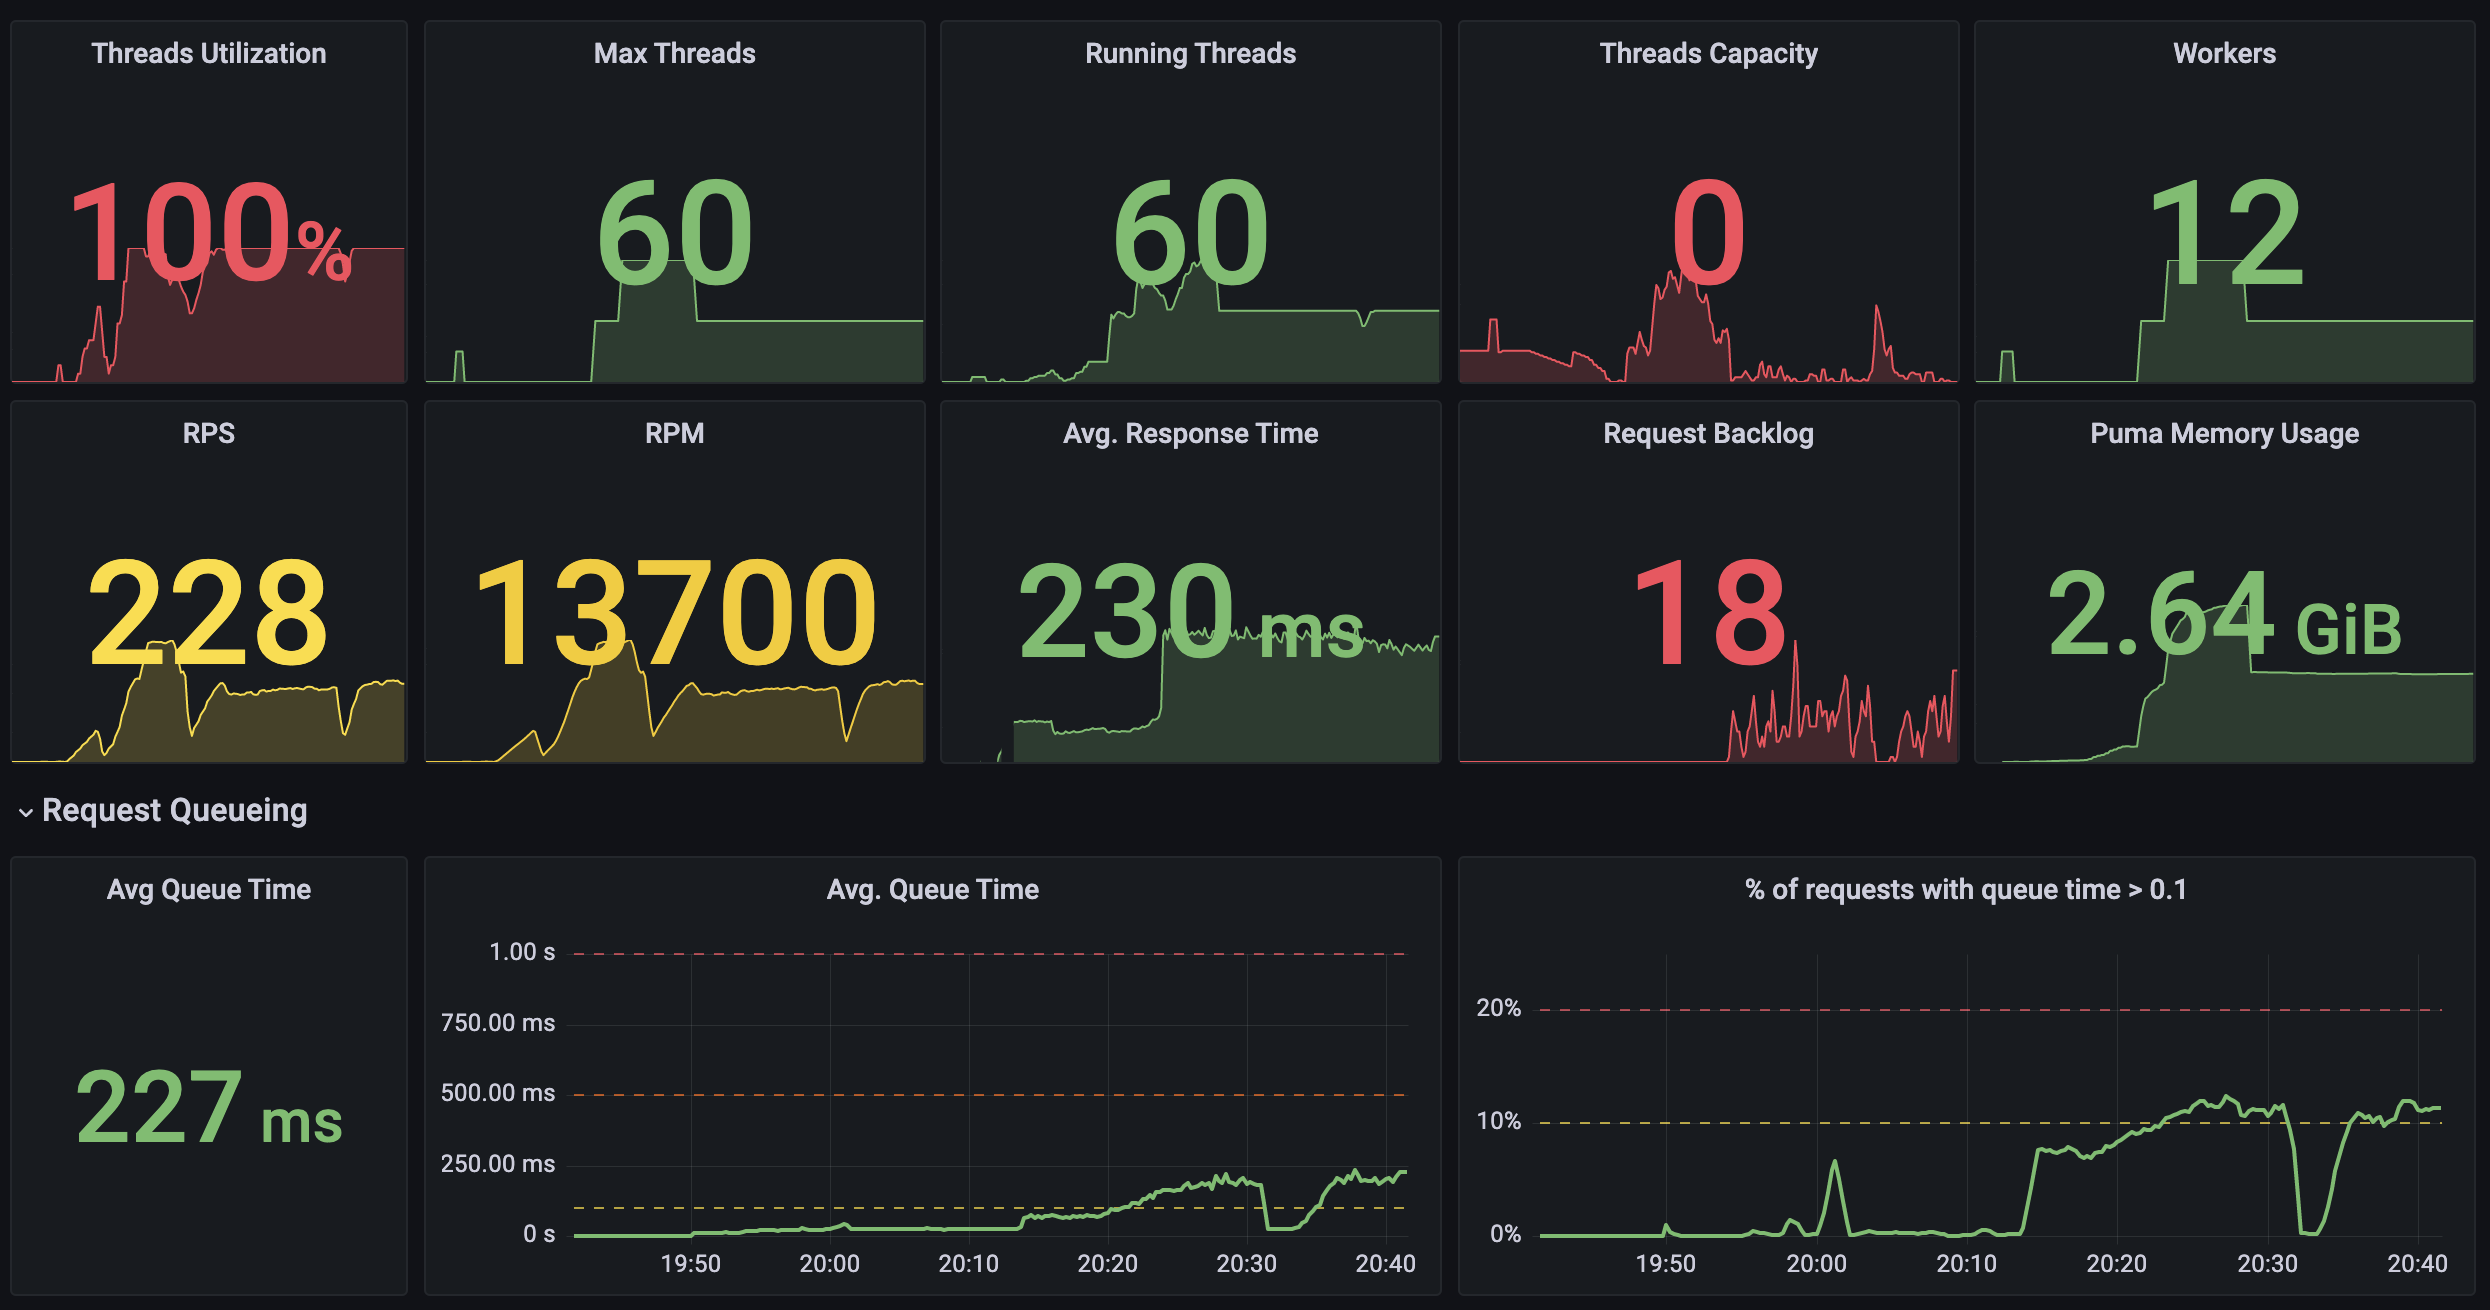
I've used stress testing tools ab and wrk to create artificial load on my dummy application, which exposes a few endpoints with various performance characteristics. Some create database records, others run heavy computations or add artificial delay. We can spot when request queue time started to creep up.
Important note: always measure P50, P90 and P99 percentiles instead of averages. Dashboard above only displays averages to illustrate the issues. A gist of other metrics we can visualize:
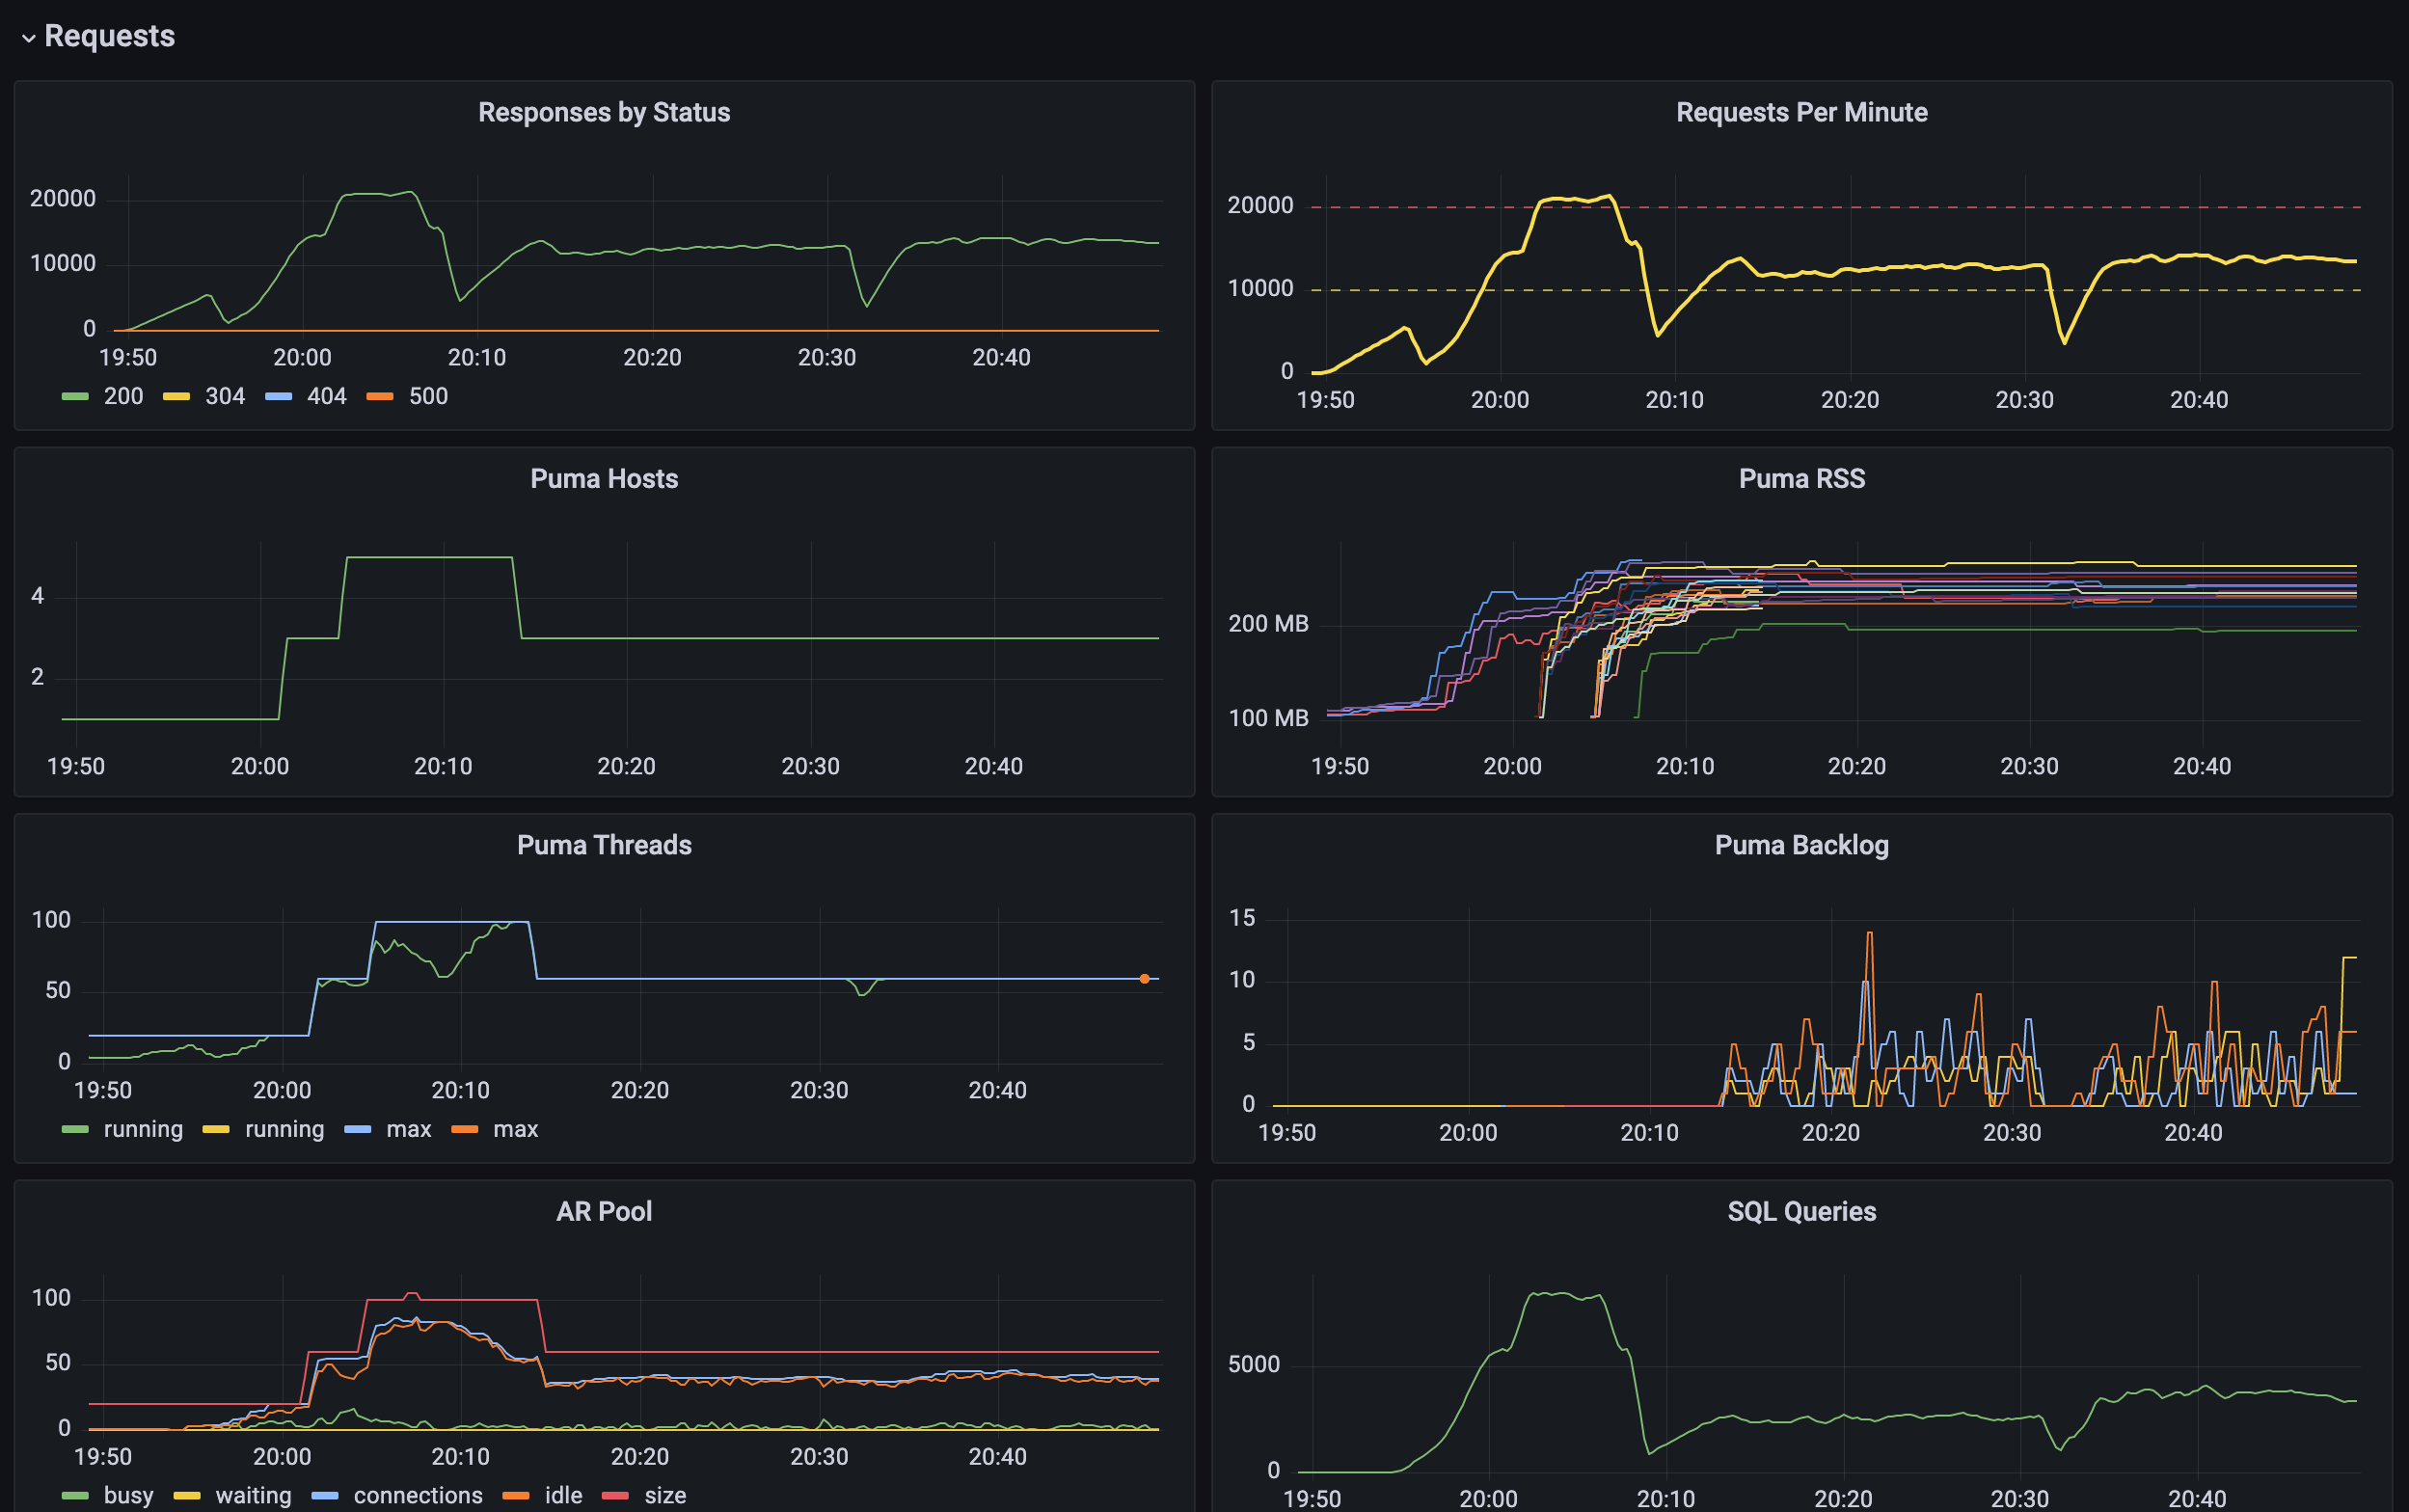
Sky's the limit when it comes to charts! I would like to provide more detailed dashboards and views (with source code) for specific queries in Part 2 of this post since it's a bit more specific to Prometheus+Grafana usage than anything else.
Wrapping up
Prometheus exporter is a gateway drug into the world of observability (and Prometheus stack!), and generally easy to configure and run on your own infrastructure. Plugged into a Rails application with minimal changes to the codebase, it allows us to quickly get performance insights and figure our the right Puma worker fleet size, among other things.